Question: Describe Demand, Supply, and Market Equilibrium (1150 words)
Answer
Demand, Supply, and Market Equilibrium
By: Essayicons.com
For demand, supply, and market equilibrium effects to take place, there must be a market. Market is the interaction between buyers and sellers for trading purposes. Markets may be local, national, or international. Market prices are influenced or rather determined by the nature of interactions between buyers and sellers.
Demand
Demand refers to the quantity of a good or service that consumers are willing and able to buy at various prices during a specific period (McConnell et al., 2018). The law of demand states that, everything kept constant, as the price of a good or a service decreases, the quantity demanded increases, and vice versa. For instance, if the demand for a particular product was “X” at $100, suppose the price of that particular product reduces to $80; the new demand will likely increase to something greater than “X.” Therefore, demand is primarily affected by the market price of a good or service.
However, besides price, demand is also affected by other various factors. One of the main factors that affect demand besides price is the consumers’ income level. Generally, except for inferior goods, consumers’ income increase leads to higher demand (McConnell et al., 2018). Another factor that influences demand is consumers’ preference and taste. Positive consumer preferences lead to increased demand and vice versa. The price of related goods also impacts demand. Related goods include complimentary (goods used together) and substitute goods (goods used in place of another good). Therefore, an increase in the price of a complementary good leads to decreased demand for the other good and vice versa. On the other hand, an increase in the price of a substitute product leads to an increase in demand for the other product and vice versa. Demand is also affected by population. A higher population typically means that the consumer base is significant, leading to increased demand for goods and services. Lastly, future expectations about price changes, income, and other factors can influence current demand. For instance, if a consumer expects that the price of a particular product will rise or they may experience a pay cut in the future, they may increase their current demand.
There are different types of demand, namely, individual, market, and derived demand. Individual demand refers to the demand for a good or a service by an individual consumer. Market demand is the total demand for a good or a service by all consumers in the market. Lastly, derived demand is the demand influenced by the demand for another good or service (McConnell et al., 2018). An example is the demand for steel, which is influenced by the demand for automobiles.
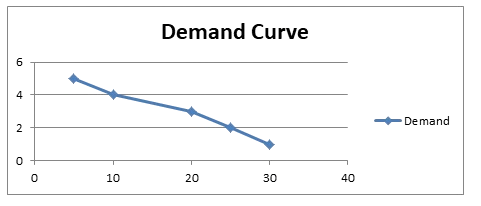
A popular concept used to explain demand is the demand curve. A demand curve is a graphical representation of the relationship between demand and price, assuming that all factors are kept constant. The curve graph comprises X and Y axes, with the X-axis representing demand and the Y-axis representing the prices. Typically, the demand curve slopes downward from left to right, illustrating the law of demand. The demand curve can be shifted by factors other than price that affect demand.

Source: Researcher
Another concept of demand is the elasticity of demand, which measures the responsiveness of the quantity demanded to price changes. Elastic demand occurs when the percentage change in quantity demanded is greater than the percentage change in price. On the other hand, inelastic demand occurs when the percentage change in quantity demanded is less than the percentage change in price.
Supply
Supply refers to the quantity of a good or service that producers are willing and able to offer in the market during a specific time period. The law of demand states that all else being equal, as the price of a good or service increases, the quantity supplied increases, and vice versa. Similar to demand, while price is the main factor that influences supply, it is also influenced by various other factors.
One of the factors affecting supply other than prices is the cost of production inputs (such as labor and raw materials). Favorable input costs lead to increased production, hence higher supply, and vice versa. Another factor is government policies. Government regulations such as taxes, subsidies, and policies can affect production costs and supply. The number of producers in the market can also influence supply. More producers or sellers generally lead to higher supply and vice versa. Expectations about future price changes can also influence the market supply. For instance, if a particular firm anticipates a future price increase, they are likely to supply less now and keep more inventories for the future.
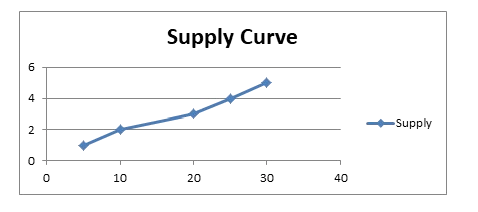
There are two types of supply: individual (supply by an individual producer) and market supply (supply by all producers in the market) (Whelan et al., 2001). The law of supply can also be presented in a graph known as the supply curve. The supply curve is a graphical representation of the relationship between the price of a good and the quantity supplied, holding all other factors constant (Whelan et al., 2001). Typically, it slopes upward from left to right. The supply curve can be shifted by all the factors affecting supply other than price.

Source: Researcher
The elasticity of supply measures the responsiveness of quantity supplied to changes in price. Elastic supply occurs when the percentage change in quantity supplied is greater than the percentage change in price. In comparison, inelastic supply occurs when the percentage change in quantity supplied is less than the percentage change in price.
Market Equilibrium
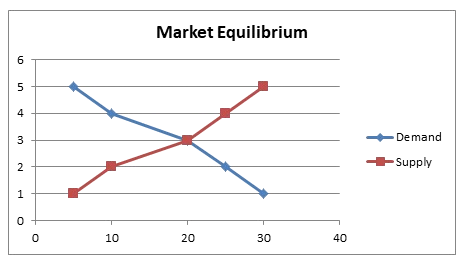
Market equilibrium occurs when the quantity of demand is equal to the quantity of supply. This results in a stable price that is mutually agreeable by both the suppliers and consumers. Market equilibrium has two categories: equilibrium price and equilibrium quantity (Dean et al., 2020). The equilibrium price is the price at which the quantity demanded equals the quantity supplied. In contrast, equilibrium quantity is the quantity of a good or service bought and sold at the equilibrium price (Dean et al., 2020).
Equilibrium is found at the intersection of the demand and supply curves on a graph representing price (vertical axis) and quantity (horizontal axis). At any place other than where the curves intersect, excess demand (shortage) or excess supply (surplus) exists in the market. Shifts in demand and supply curves (due to factors affecting demand and supply other than price) can cause changes in equilibrium price and quantity. An increase in demand shifts the demand curve to the right, leading to higher equilibrium prices and quantity and vice versa. Similarly, an increase in supply shifts the supply curve to the right, leading to a lower equilibrium price and higher equilibrium quantity and vice versa.

Source: Researcher